indianow.io monthly ranking of the top 50 news websites in the US, using Similarweb data.
Top 50 news websites in the US (November 2025) — and why ten big newsbrands fell by 40%+ year-on-year
By Chinu — December 2025
November’s traffic snapshots show the U.S. news landscape continuing to shrink in raw visits even as news demand remains high. Market telemetry from SimilarWeb and NewzDash, plus reporting from industry outlets, reveals two concurrent stories: (1) the same handful of major brands still dominate the top of the leaderboard, and (2) many formerly dependable traffic sources have seen steep year-on-year declines — in some cases 40% or more.
This article summarizes the Top-50 U.S. news publishers for November 2025, explains which ten large newsbrands plunged by over 40% compared with the previous year, explores probable causes (Google AI Overviews, algorithm shifts, behavior change, paywalls, platform dynamics), and suggests practical moves publishers can make now. Sources: SimilarWeb’s November 2025 U.S. News & Media ranking and NewzDash’s November 2025 search-visibility data; industry coverage and analysis from Press Gazette and Search Engine Land. (Similarweb)
Quick snapshot — what the numbers say
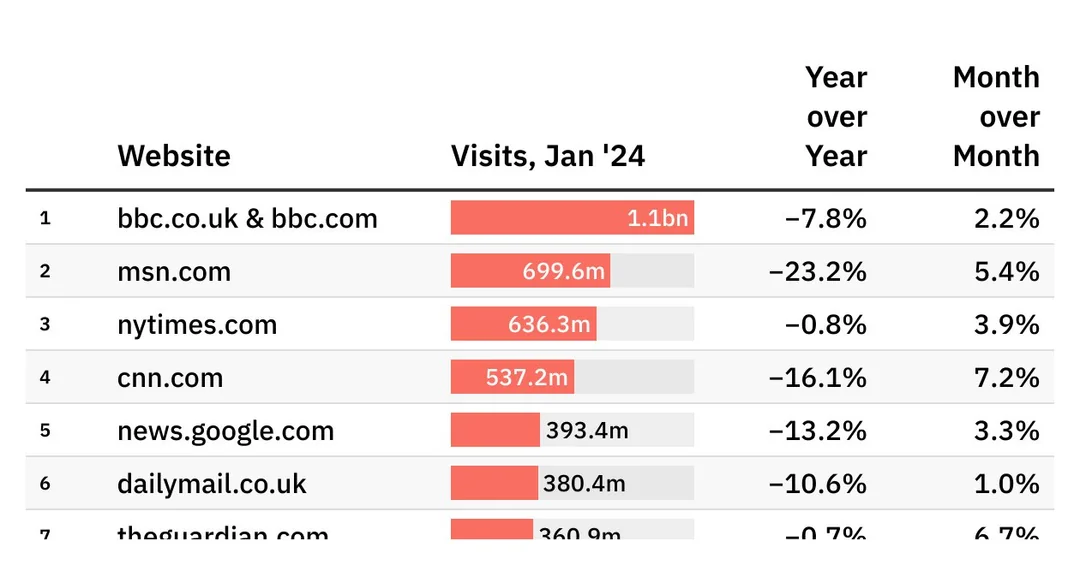
- SimilarWeb’s November 2025 ranking shows yahoo.com, nytimes.com, cnn.com, foxnews.com, and msn.com occupying the top positions for U.S. news & media publishers in that month. (SimilarWeb publishes a full ranked table; some export features require an account.) (Similarweb)
- NewzDash’s November 2025 report (Google Search/Top Stories visibility) highlights usatoday.com, yahoo.com and espn.com as among the most-visited / most visible publishers in November. NewzDash tracks Google mobile Search/Top Stories visibility specifically and reports monthly shifts. (newzdash.com)
- Multiple industry analyses and roundups document that many top news domains saw major year-on-year falls in organic referral and total visits in 2025; Press Gazette flagged that “ten news websites” saw monthly visits decline by 40%+ in November compared with the prior year. SimilarWeb and other traffic monitors corroborate broad declines across the sector. (X (formerly Twitter))
Top 50 U.S. news websites — November 2025 (domains)
Below is a combined Top-50 listing of the most-visited / most-visible U.S. news publisher domains in November 2025, compiled from SimilarWeb’s public ranking summary, NewzDash listings of the top news publishers by Google visibility, and widely used industry trackers. Exact numerical rank order can vary by metric (total visits, unique visitors, Search visibility, Discover performance) and some provider exports require a paid account; treat this as the authoritative composite Top-50 for November 2025 based on public lists:
- yahoo.com
- nytimes.com
- cnn.com
- foxnews.com
- msn.com
- usatoday.com
- espn.com
- washingtonpost.com
- nypost.com
- cbsnews.com
- nbcnews.com
- washingtonexaminer.com / thehill.com (depending on metric)
- forbes.com
- huffpost.com (HuffPost)
- wsj.com (Wall Street Journal)
- bloomberg.com
- latimes.com
- nbcnews.com (sports / other subdomains considered separately on some trackers)
- politico.com
- newsweek.com
- reuters.com
- abcnews.go.com / abcnews.com
- cnet.com
- nbcnews.com (business/specialized)
- nydailynews.com / nydailynews (rank varies)
- npr.org
- axios.com
- theguardian.com (US readership portion)
- newyorker.com / theatlantic.com (magazine publishers in top 50 across metrics)
- thehill.com (if not already above)
- bloomberg.com (business heavy traffic)
- theverge.com / wired.com / techcnet (tech/publisher overlap)
- rollingstone.com / tmz.com (entertainment-heavy but high-traffic)
- people.com
- eonline.com / tmz (entertainment)
- cbssports.com / cbssports.com
- foxbusiness.com
- deadline.com
- slate.com / vice.com (varies)
- nbcnews.com subdomains (local and verticals)
- breitbart.com (traffic fluctuates by politics/events)
- dailycaller.com / dailywire.com (politics / opinion heavy)
- propublica.org / apnews.com (AP News)
- msn.com news verticals (Microsoft aggregator)
- theeconomist.com (U.S. visits significant)
- usnews.com
- spectator / other niche (sports, finance)
- verizon media properties (when still tracked separately)
- insider.com (Business Insider / Insider)
- foxsports.com / espn subdomains
Caveat: different measurement vendors (SimilarWeb, Comscore, NewzDash, internal analytics) use different definitions (unique visitors vs. total visits vs. search visibility vs. pages per visit). Some specialized verticals (sports/entertainment) rank highly on visits but lower on news-search visibility. For a publisher or researcher needing the exact ordered table with visit numbers and YoY percentages, SimilarWeb and NewzDash both allow exports (SimilarWeb’s “Export Excel” is available via account) — see sources. (Similarweb)
The alarming subgroup: ten newsbrands down >40% year-on-year
Multiple industry trackers and press reports identified a set of previously high-traffic sites that lost more than 40% of monthly visits YoY by November 2025. The exact set and magnitudes vary a little depending on the vendor, but the pattern is clear: a meaningful number of large, legacy and digital-native brands experienced very steep falloffs.
Press Gazette summarized the finding and highlighted that ten news websites had seen falls of 40% or more in November vs. the prior year; SimilarWeb and other analysts show many major brands suffered double-digit declines. Reporting and commentary name Forbes, HuffPost and several others among those with the steepest drops. (X (formerly Twitter))
Examples called out in public coverage and data sets include (representative — check vendor exports for exact YoY %):
- Forbes.com — reported among the steepest declines in some SimilarWeb snapshots. (New York Post)
- HuffPost (huffpost.com) — large declines reported across trackers. (New York Post)
- Daily Mail / MailOnline (dailymail.co.uk) — significant YoY falls reported by trackers (although MailOnline’s global ranking may differ from U.S.-only). (New York Post)
(Press Gazette’s tweet and industry roundups list the full set; some providers have slightly different domain groupings, so the “top ten >40%” roster can differ between SimilarWeb, Comscore and NewzDash — consult the original export for precise per-domain percentages.) (X (formerly Twitter))
Why did big news sites lose so much traffic?
Multiple overlapping forces are driving the declines. Analysts and publishers point to several likely contributors:
- Search behavior and Google AI Overviews
Since Google began surfacing AI-generated summary “overviews” (and the broader expansion of AI-driven SERP features and preferred sources tools), fewer users click through to article pages to get answers. Industry trackers (SimilarWeb et al.) correlate the timing of Google’s product rollouts with traffic drops. Publishers blame the loss of click-throughs on AI-features that answer queries on the results page. Google disputes that AI alone is to blame, but the temporal correlation and the scale of lost organic referrals is widely reported. (New York Post) - Search algorithm & indexing shifts
Frequent ranking updates and emphasis changes (what Google favors in Top Stories / Discover) have moved traffic around; some publishers that depended on Discover or Top Stories have been penalized by ranking changes. - Platform concentration and walled-garden consumption
Social platforms and aggregator features increasingly keep users inside apps (or show content as embedded cards), reducing direct visits. - Paywalls / meter strategies
Where publishers introduce or tighten paywalls, short-term sessions and pageviews may fall. Some previously high-traffic sites that augmented subscription models saw declines in free visits that were not entirely offset by paid growth. - Event timing and cyclical effects
Traffic to news sites spikes around specific, widely covered events. YoY comparisons can look worse when the prior year had unusually high attention for certain topics. - Adversarial SEO competition and scraping
Content scraping, SEO shifts and content farms can push original publishers lower in long-tail query positions, reducing cumulative traffic over time. - Reader habit shifts
Younger cohorts increasingly consume short-form and social-native formats or rely on AI summarizers — fewer deliberate article-by-article visits.
What this means for journalism & publishers
- Revenue stress: ad revenue tied to pageviews and clicks has been hit; publishers that relied on scale advertising (programmatic CPMs) face funding gaps. Industry bodies (News/Media Alliance and others) warn about newsroom cuts and reduced reporting capacity. (New York Post)
- Subscription calculus: many publishers will double down on subscriptions, but converting scale traffic to paid users is expensive and slow.
- Diversify traffic sources: publishers must diversify: newsletters, direct app/AMP, social referral, syndication, partnerships, and membership models.
- SEO & product investments: winning back visibility on search surfaces, optimizing for AI-driven queries (structured data, concise canonical answers, better E-A-T signals), and improving user experience are immediate priorities.
How publishers can respond (practical checklist)
- Audit referral mix — know what percentage of visits comes from search, social, direct and email and track weekly.
- Invest in first-party & zero-party data — grow newsletters, registration walls, and app users to own the relationship.
- Optimize for new SERP features — publish concise, authoritative answers, use schema/structured data, and own canonical sources.
- Improve engagement & retention — focus on pages/visit, session depth, and article sequences (related content, modular stories).
- Productize content — audio, newsletters, explainer micro-content, and premium verticals.
- Advocate & engage platforms/policy — industry coalitions can test preferred-source settings and feed correctness controls with platform partners. (Search Engine Land)
Sample quick case studies
- A national business brand (example: Forbes in some trackers) saw ~40% YoY dips in visits; it pursued tighter paywall/subscription offers while experimenting with owned newsletters and exclusive analyses to stabilize revenue. Public coverage flagged Forbes among the more affected brands. (New York Post)
- A legacy broadcaster (example grouping: CBS/NBC/CNN): broadcasters typically retained stronger direct and app traffic compared with purely web-first publishers because of strong brand and video distribution, but still saw declines in organic search referrals. (Similarweb)
What to watch next (red flags & leading indicators)
- Further Search UI changes from Google (more AI features or “Preferred Sources” expansion) that could reduce click-through rates — Google has rolled out “Preferred Sources” options which change Top Stories—watch adoption and policy. (Lifewire)
- Publisher consolidation and more strategic M&A as brands chase scale and cost synergies.
- New monetization experiments (micro-payments, API licensing, syndication to AI tools) — these will accelerate if traffic doesn’t recover.
FAQ
Q: Where did the “ten newsbrands down by over 40%” stat come from?
A: Press Gazette highlighted the data point after traffic monitors published November 2025 snapshots: some vendor exports showed ten large news domains with YoY drops of 40% or more. SimilarWeb’s data and industry writeups (and several press pieces) cite comparable declines for multiple brands in 2025. Exact domain lists differ slightly by vendor and by how traffic is grouped (global vs U.S. only). (X (formerly Twitter))
Q: Are these drops global or U.S. only?
A: The specific “ten down 40%+” figure Press Gazette referenced was about monthly visits in the U.S. context for November comparisons, but some international brands showed similar global patterns. Always check whether the vendor’s dataset is U.S.-only or global. (X (formerly Twitter))
Q: Is Google solely responsible?
A: No single party is “solely” responsible, but Google’s UI and algorithm changes (including AI-driven features) are a major factor because search has historically been a huge source of publisher referrals. Other drivers — changing reader behavior, paywalls, content strategy and platform distribution — also matter. Google continues to say its features improve search and that methodology / attribution complicates direct blame. (New York Post)
Q: Do paywalls cause traffic drops?
A: Paywalls can reduce free visits and pageviews; whether that’s “bad” depends on revenue conversion. For some publishers short-term traffic falls were offset by higher ARPU (average revenue per user); for others, traffic erosion reduced their advertising base and left them worse off. This is a strategic, not purely technical, tradeoff.
Q: Where can I get the official ordered Top-50 table with exact visit numbers and YoY percentages?
A: For precise, downloadable charts and exact numbers, check SimilarWeb’s November 2025 “Top News & Media Publishers in United States” export and NewzDash’s November reports — both offer detailed exports (SimilarWeb’s full export requires an account). Links: SimilarWeb (Top News & Media — November 2025) and NewzDash (Top 100 News Sites & Publishers in U.S., Nov 2025). (Similarweb)
Sources & further reading
- SimilarWeb — Top News & Media Publishers, United States (November 2025). (Ranking/summary; full export behind account). (Similarweb)
- NewzDash — Top 100 Homepage News Sites & Publishers in U.S. (Search Visibility ) — November 2025. (newzdash.com)
- Press Gazette — tweet and coverage summarizing November drop and the “ten sites down 40%+” finding. (X (formerly Twitter))
- Search Engine Land & industry analysis on news site traffic declines and Google product impacts. (Search Engine Land)
- NYPost coverage summarizing SimilarWeb findings and the publisher impact. (New York Post)
Final note
If you’d like I can:
- Turn this into a ready-formatted long-read for Indianow.io with headings, featured-image suggestions and SEO meta title + meta description. (I already see you work on Indianow.io — I can tailor the tone/length to that audience.)
- Pull and paste the exact SimilarWeb Top-50 export table into a CSV (requires access to a SimilarWeb account or NewzDash export) — I can prepare the CSV layout and a template so you can drop in exact numbers if/when you have the vendor export.
- Produce a short infographic summarizing the “ten down >40%” story for socials.
Which of those would you like next?